Particle Physics Domain Result Replication Project
[WPSM_AC id=1288]
Group members: Bryan Alexis Ambriz, Charul Sharma, Rui Lu
Abstract
In the field of particle physics, there are myriad of methodologies for model-making decisions which we need to balance. Due to particle-tracking properties (like the incredibly short lifetime of particles), distinguishing jets and particles requires some helps from artificial intelligence or deep learning. Our project utilized elements of Graph Neural Networks, including convolutional layers such as EdgeConv and GENConv. In Quarter 1 of our project, we looked at how the Deep Sets Neural Network (DSNN) & Fully-connected Neural Network (FCNN) perform using a Reciever-Operating Characteristic (ROC) curve and AUC% (Area Under the Curve) of the aforementioned ROC.
In this quarter (Q2), we had hoped to extend and out-perform the previous models utilizing a graph neural network, which we believed was able to capture the inherent structure of the data generating process (DGP), aka. the particle collisions. A ROC curve helps visualize the false positive and true positive rate of our model, while the AUC provides a point estimate that tells us how our model is doing overall. We also used Designed Decorrelated Taggers (DDT) to decorrelate the predictions from the jet mass using a mass-varying threshold for cuts on the output predictions of our model. This procedure helped further cement the finding that jet mass is a particularly good estimator for discovering H->bb jets, and therefore Higgs Boson fields/particles.
Introduction
Before having more details of our project, some physics terms need to be explained. A jet is a spray of particles that goes in the same direction. And there are tons of jets when we collide the protons like q/g jet, b jet, W/Z -> qq jet and H->bb jet. Due to the properties of jets, it reproduces the Higgs boson more likely. We need to distinguish the H-> bb jet from all the others. As for the importance of Higgs boson particles, it is the first and only spineless elementary particle observed and the building blocks of the universe while it is the mass givers of other particles. Diving deep into the unknown properties of Higgs boson would definitely help us to understand the existence of universe and something relevant to the dark matter.
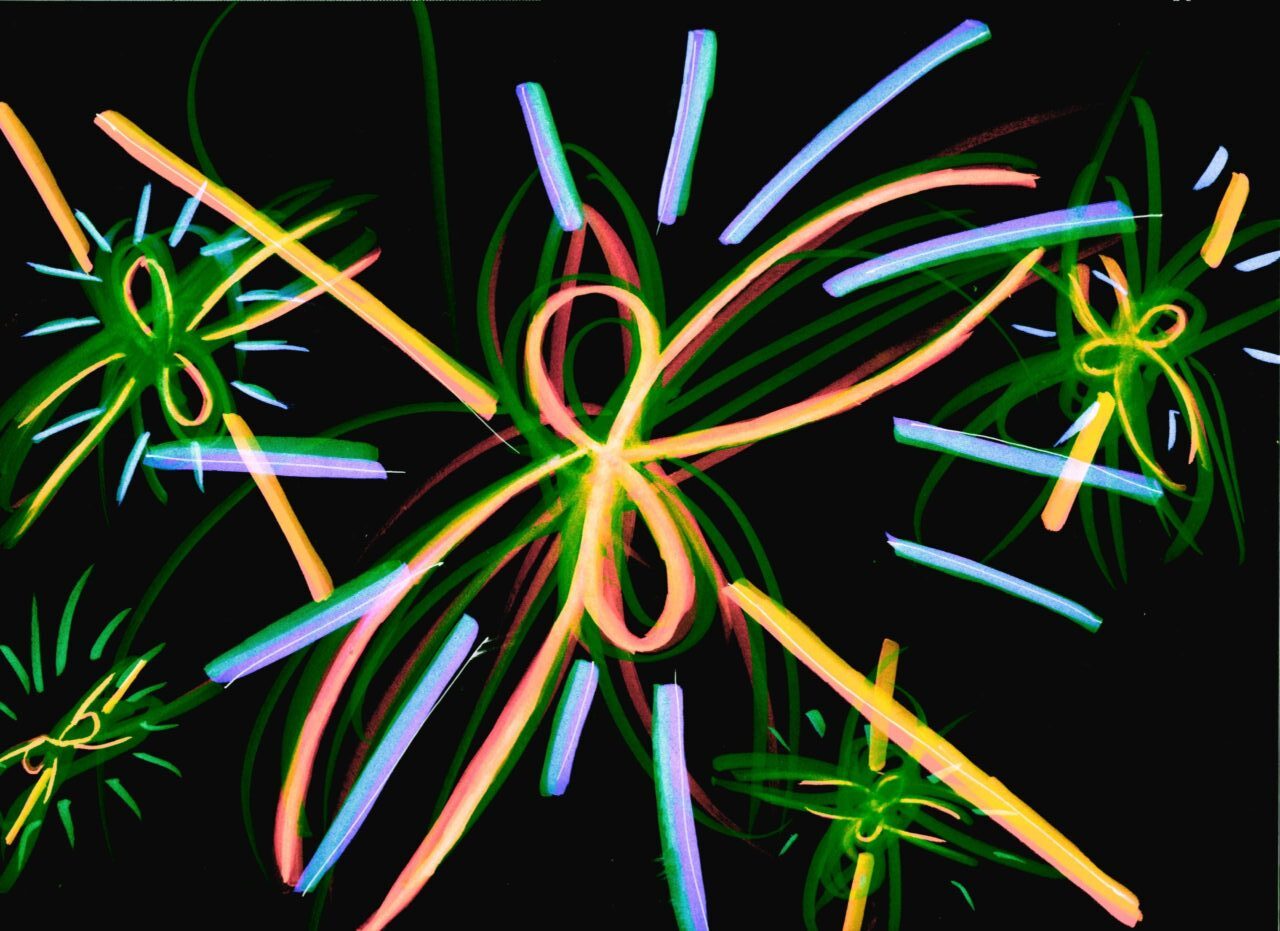
The event shown in the blue cylinder is a visualization made by the CMS experiment that shows a decay into two photons (dashed yellow lines and green towers).
Source Data
The data collected at CERN (European Organization for Nuclear Research) was gathered by using simulated proton collision events. These events were used to gather information about track, secondary vertex, and jet feature data which could be used to inform the machine learning algorithms which can classify Higgs Bosons as they decay to bottom quark-antiquark pairs.
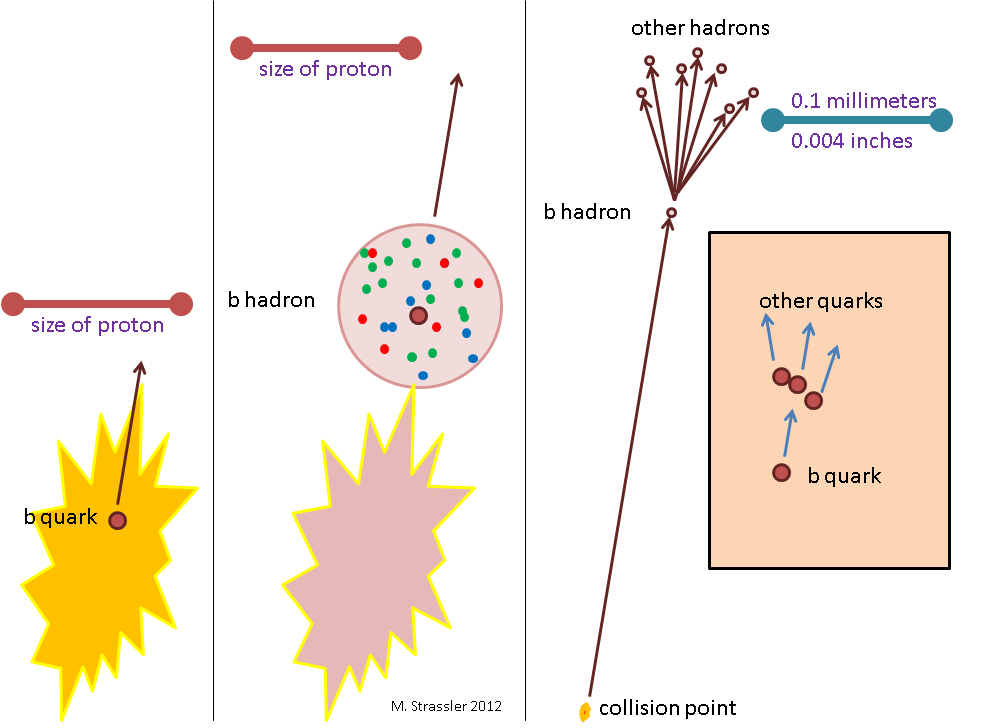
The diagram above shows the b hadron which we are targeting. The b-hadron decays into particles / other hadrons on the left, after it has already traveled from the collision point. Source: https://profmattstrassler.com/articles-and-posts/particle-physics-basics/the-known-apparently-elementary-particles/jets-the-manifestation-of-quarks-and-gluons/b-tagging-identifying-jets-from-bottom-quarks/
Features
| Feature Type | Description |
|---|---|
| Labels | Labels in the dataset are used to differentiate between H-bb jets and all other jet types resulting from the strong interaction between quarks and gluons (e.g. quantum chromodynamics, aka QCD). |
| Track Features | Track features in the dataset are properties of tracks (e.g. transverse momentum / maximum relative momentum, number of tracks, maximum signed 3D impact parameter value, etc.). Tracks themselves are simply the paths which the newly created hadrons (resulting from the particle collisions) took as they exited the collision. |
| Secondary Track (SV) Features | SV Features in the dataset are properties of the decay occurring and jet originating at the secondary vertex (e.g. transverse momentum / maximum relative momentum, number of secondary vertices … etc.). The secondary vertex is the location where a bottom hadron decays into other hadrons; a significant number of hadrons from a jet initiated by the production of a bottom quark come not from the collision point, but from the secondary vertex. |
| Jet Features | Jet features in the dataset are properties of the jet itself, a collection of particles which emanate and collimate from the initial collision point (e.g. transverse momentum / maximum relative momentum, sdmass, mass. … etc. ). The jet itself is the target of classification for our purposes of detecting h->bb jets. |
Methodology
Graph Neural Networks
Graph neural networks are a type of machine learning which takes or extracts key information from a graph that contains nodes and edges like jets of particles. Based on this information, graph neural networks make predictions. Taking the social relation as an example, the nodes would be individuals and the edges could be the relationships between each individual.
Designed Decorrelated Tagger (DDT)
DDT could provide a simple approach to substructure decorrelation that the DDT transform yields a jet substructure discriminant which is decorrelated from the jet mass. (The ATLAS Collaboration 2018) Meanwhile, it could also define a mass-dependent threshold to reduce the impact. Decorrelating the jet mass is useful as the model can learn to distinguish signal from noise using the difference in mass.
GENConv
GENConv is a model for implementation of GCNs(Graph Convolutional Networks).The model combines information from the regular node and its neighbor by aggregating then updating the node feature by giving the aggregated value. As for regular GCNs, it just gives the information about connected neighbors for updating the node feature. It has a novel generalized aggregation function which could cover all common sorts of aggregation functions which improves the performance.
EdgeConv
EdgeConv is the implementation of deep learning models and it acts on graphs dynamically computed in each layer of the model. It incorporates local neighbor information and can be used for learning the global properties. And it helps the model to handle irregularity easily but the major difference between this and other methods is that it captures the local geometric structure while still maintaining its own permutation invariance. Besides that, EdgeConv could generate edge features that describe the relationship between a node and the neighbors and is capable of grouping nodes both in Euclidean space and in semantic space which would be extremely useful for particle physics.
Summary of Results

Jet Mass / QCD Background
The figure above shows the background jet mass distribution estimate of our model. The blue curve represents our predictions of H-bb jets as they are, given the distribution when we select 99% true positives. The red curve shows the impact of the DDT procedure of the signal, showing that it removes a majority of the signal, essentially estimating noise / qcd background mass.

Jet Mass / H-bb Jets
The figure above shows the signal jet mass distribution estimate of our model. The blue curve is the same in both figures. The red curve now is a tighter fit on the ‘base’ or training distribution of h-bb jet mass, and shows lower probabily of detection.
Reciever-Operating Characteristic Curves

After visualizing the ROC curves without DDT and comparing the AUC of our GENConv Graph Neural Network to the previous FCNN/DSNN we found an improvement of about 1.2% to last quarters highest-performing model, the Deep Sets Neural Network. However, the improvement was much more when compared to the more basic FCNN, as we saw an improvement of about 9.4%.

Applying the DDT procedure (i.e decorrelating the mass from the signal/qcd background) shows us that results of our model get worse when the influence of mass is removed from the predictions – and the influence is visible across models and the difference maintains the order in terms of performance.

We merge the two figures above and provide a combined ROC curve of ablated DDT procedure to easily compare the curves.
Conclusion
Ultimately, we were able to replicate figures 4, 5, and 8 in the paper “Interaction networks for the identification of boosted H → bb decays” by Duarte et.al. We discovered that Jet mass is a valuable predictor for the Higgs Bosons and that the choice of model is crucial in improving the accuracy. For example, we found the Deep Sets NN model performs about equally to our fairly simple Graph NN, because the the variable nature of Deep Sets is able to capture the inherent structure of the ROOT / Awkward data provided by CERN / LHC. Further, looking at the jet mass distribution and the effect DDT has on our predictions of it was able to convince us that decorrelating the mass is not a good idea.
Credits
This project was a lot of hard work, and was difficult for us to conceptualize as none of the students on our team had any background in particle physics. However, the process of discovering new methods in conducting data analysis by replicating the results in Dr. Javier Duarte’s paper was helpful. We have him to thank for providing resources such as providing the graph dataset which was used to transform the raw data into a more usable format, as well as early-stage models (Deep Set, Fully-Connected, Adversarial, and Interaction Neural Network) for inspiration. Our TA Farouk Mohktar was also helpful in providing guidance and clarity on our project.
References
Duarte, Javier M. “Interaction networks for the identification of boosted H→bb⎯⎯⎯ decays.” Arxiv, 2019, p. 20. Cornell University, https://arxiv.org/abs/1909.12285. Accessed 6 March 2022.
Wang, Yue. et. al. “Dynamic Graph CNN for Learning on Point Clouds.” Arxiv, 2018, p. 13. Cornell University, https://arxiv.org/abs/1801.07829. Accessed 8 March 2022.
Guohao Li et. al. “DeeperGCN: All You Need to Train Deeper GCNs.” Arxiv, 2020, pg. 16. Cornell University, https://arxiv.org/abs/2006.07739. Accessed 8 March 2022.